Bat tracking data from MLB and Triple-A games is available for Major League Baseball teams. All these metrics are available to include on custom reports and we also added some filters specific to this data.
Metrics
|
Name |
Definition |
|---|---|
|
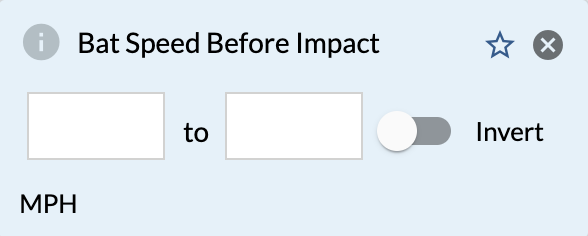
BatSpeed (MPH) |
Speed of the sweet spot just before impact. |
|
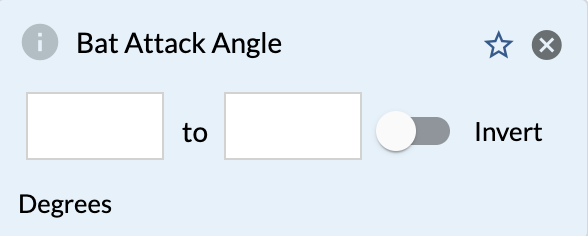
BatAttackAngle (Degrees) |
The angle of the bat's path, at impact, relative to horizontal. A negative value represents swinging downward, a positive value upward. |
|
BatImpactAngle (Degrees) |
Top-down view of the angle of the bat at impact or closest point on missed swings normalized to the batter's hand. 0 represents perpendicular to the pitcher's mound, negative is before the bat reaches perpendicular, and positive is after the bat reaches perpendicular |
|
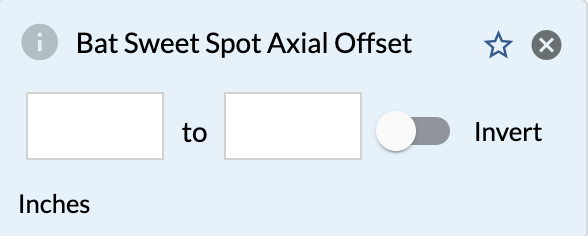
BatAxialOffset (Inches) |
Distance from the sweet spot to the impact point along the bat. Negative is toward the handle of the bat, positive towards the head |
|
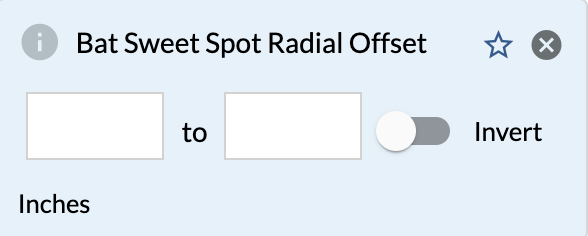
BatRadialOffset (Inches) |
Distance from the sweet spot to the impact point perpendicular to the bat. Negative is below the center of the bat and positive is above. |
|
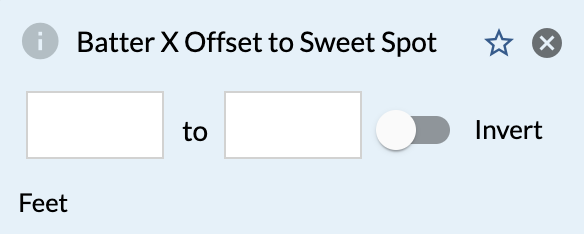
BatBatterAbsXOffset (Feet) |
Absolute value of the distance from the batter's center of mass to the contact point at impact in the horizontal dimension. |
|
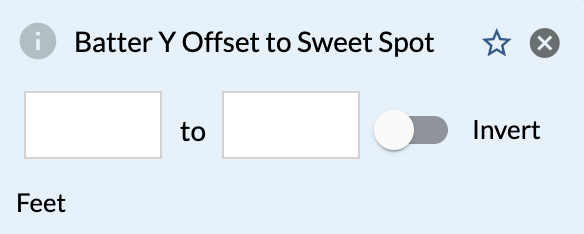
BatBatterAbsYOffset (Feet) |
Distance from the batter's center of mass to the contact point at impact in the depth dimension. Negative is toward the backstop, positive is toward the pitcher's mound. |
|
BatVerticalAngle (Degrees) |
The angle between the bat and an imaginary vertical line perpendicular to the ground |
|
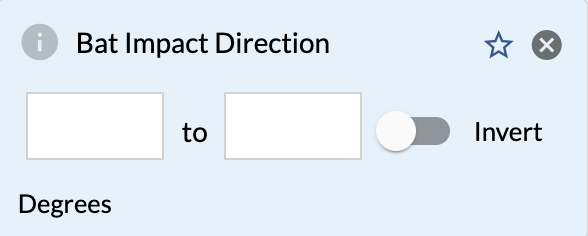
BatImpactDirection (Degrees) |
Top-down view of the angle of the bat at impact or closest point on missed swings. 0 is toward the pitcher's mound, negative is toward third base, and positive is toward first base. |
Filters
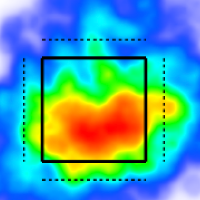
Charts
Graphical Splits Page
Charts Page
Individual Team or Player Page