Catcher Framing model
This post explains TruMedia's model for catcher framing and answers questions about inputs, approach and derived statistics.
We built a set of models (one for each level) for every pitch thrown at each level, to estimate the probability of that pitch being a called strike. We call this model-based estimate ProbSL.
The model is designed to predict the chance a given pitch, if taken, will be called a strike. The primary inputs to the model are the pitch location at the front of the plate, the batter handedness, the top and bottom height of the batter's strike zone, and the count. The model is calibrated for each season and level of play (AAA can have a different strike zone than MLB or AA and 2018 can have a different strike zone than 2017, etc). We use the prior season's model through the All-Star break, then build a new model for the current season at the All-Star break and update it at the end of the season.
Excluded variables
Players and umpire. One of our goals was to visualize the areas of the zone that catchers and umpires were performing differently than league average. We decided to leave out player effects in the model to avoid skewing the spatial effects. While a given umpire could increase total strikes, it's possible he decreases them to (for example) lefties inside and we wanted to make sure we didn't skew that.
Pitch type, velocity, movement, batter height (beyond his strike zone bounds). We do not currently incorporate these variables and will consider adding them into the model in the future, as all could improve the core model.
Notes on TruMedia's modeling approach
Each taken pitch is bucketed per batter hand, per year, and per level of play into a 60x60 grid around the zone to get a baseline probability of called strike. We then smooth that, since those buckets are little less than one square inch each. We then apply a transform for the count, so that each count has exactly the correct number of predicted called strikes (so 3-1 counts predict more strikes than 0-2 counts for pitches in the same location).
We do not factor in the players or umpires involved. This allows us, with enough data, to show how catchers and umpires (and to a smaller extent batters and pitchers) vary from the league averages. For an individual pitch, since players aren't accounted for, an umpire may be judged a bit harshly when dealing with a catcher who's very good at framing.
As mentioned, we do not factor in as many things as some models, since we do not include players, umpires, pitch types or velocity. This is a tradeoff to ensure that we can fully calibrate things over the space of the zone. Many other models regress things in ways that distort the zone, and while it may be true that a given umpire increases called strikes, it may not be true that he does that evenly across the strike zone, so it may distort the impact of inside pitches to apply a fixed factor per participant.
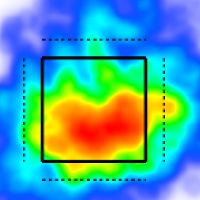
The main thing that's unique about our model is the ability to view it on a heatmap and see where a catcher or umpire is differing from the league.
FAQs
What is expected called strikes# and how is it defined?
The sum of the "ProbSL" value for each pitch in the result set. This is how many strikes we expect to be called based on our model's estimate of the probability of a strike for each pitch. (more discussion about model specifics below)
How do you handle ABS games?
We calculate the called strike probability for all unchallenged pitches in challenge games. We do not calculate the called strike probability for full ABS games or on challenged pitches.
What is the most important catcher stat pertaining to framing?
For trying to answer the question: Who is the best catcher at framing? We think the SL+ metric, which measures how many strikes per 100 expected strikes did the catcher achieve. This is a "rate" version of SLAA, mentioned below.
What metric should be used to answer the question: who provided the most value to their team via framing?
We suggest the raw SLAA (Strikes looking above average) number. This is a measure of the total number of called strikes looking minus the called strikes expected.
What’s the difference between FrmRAA and FrmCntRAA?
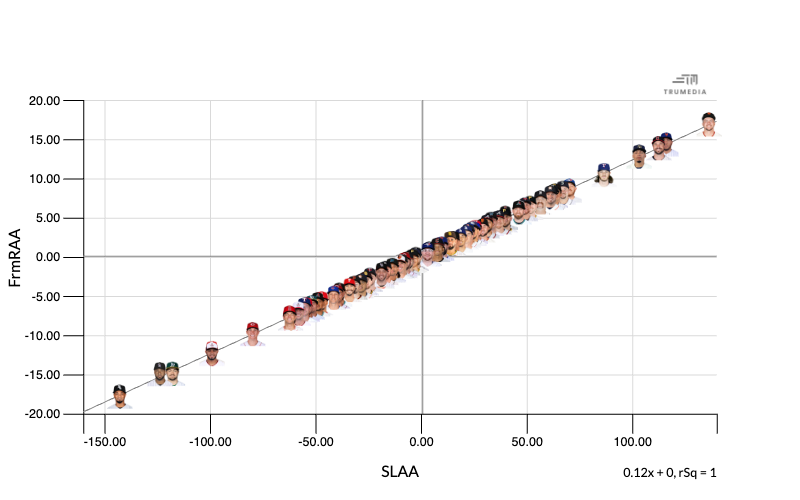
FrmRAA (Catching Frame Runs Above Average) translates each called pitch from units of strikes (SLAA) into a linear weighted run value. As you can see in the first scatter chart below, plotting FrmRAA by SLAA results in a straight line.

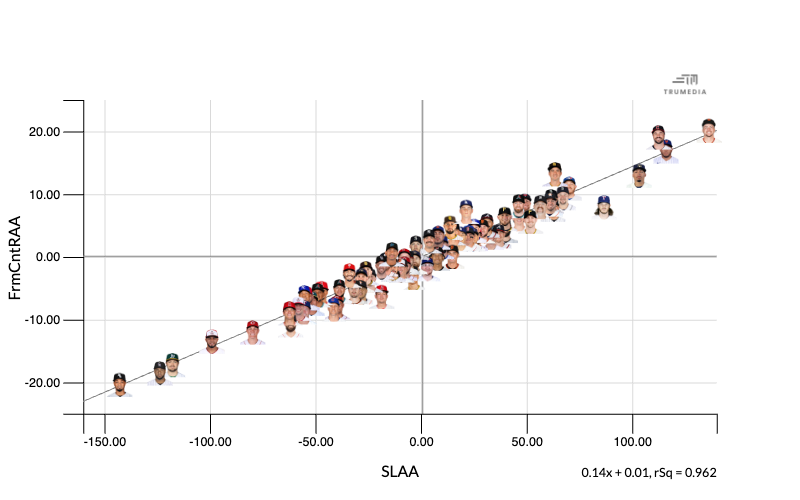
FrmCntRAA uses a count sensitive calculation to value each strike, meaning that a framed strike that results in a strikeout on a 3-2 count would be more valuable in terms of runs than a frame strike on a 0-0 count. In the second scatter below, you can see that plotting FrmCntRAA by SLAA doesn’t result in a less straight line.

