
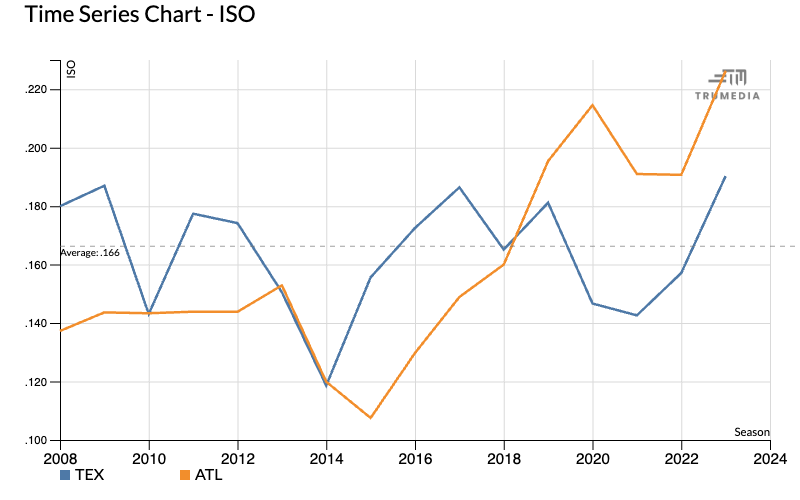
A time series chart shows trends in the data over time. The example below shows team ISO by season for the Texas Rangers and Atlanta Braves from 2008 to 2023.
Create a Time Series Chart
-
Open the Graphics menu
-
Select Time Series Chart.
Pin a team and add a stat
-
Tap the plot stat button next to the name of a stat.
-
Pin a player or team on the leaderboard.
Include All Seasons
-
Toggle the Include All Seasons option.
Change the time interval
-
Select an option in the Group By menu.
Change the line type
-
Select an option in the Line Type menu.
Pin more teams/players
-
Scroll down to the leaderboard.
-
Pin a player or team on the leaderboard.