Bar Chart
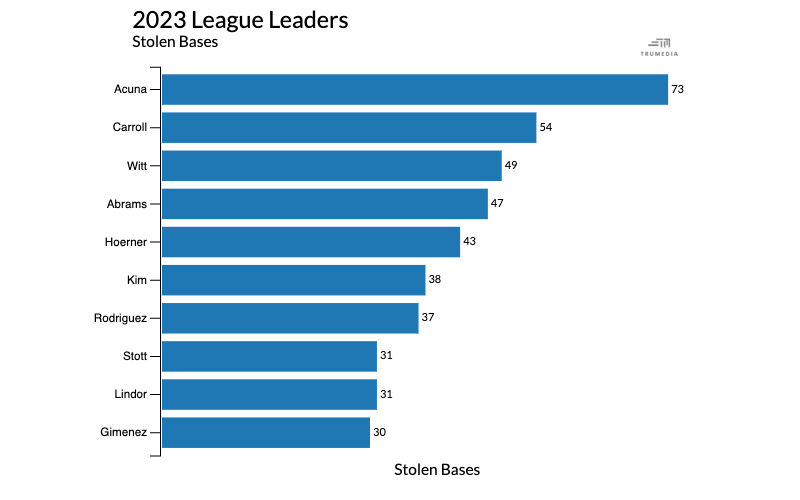
A bar chart is used to compare performance for one stat; the size of the bar on the chart corresponds to the number value. The example below shows total stolen bases for the top ten players in the 2023 MLB season
The league leader was Ronald Acuña with 73 stolen; this is represented by the largest blue bar at the top of the chart. At the bottom of the chart is the Andres Gimenez with 30 stolen bases. His bar is smaller.

Create a Bar Chart
Open the Graphics menu and select Bar Chart.
Change the stat
Tap the Plot Stat button next to a stat on the table
Bar count
Choose an option in the Bar Count menu.
Add titles
Type in the text boxes.
