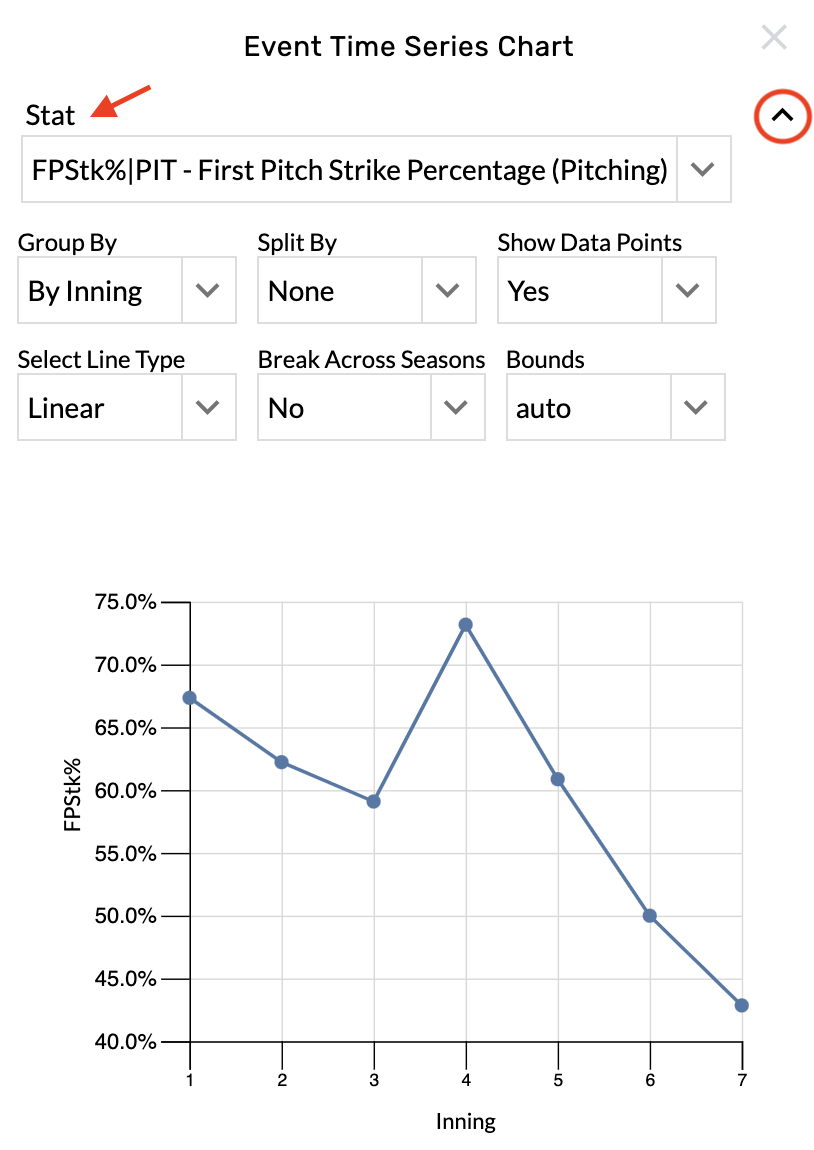
Add a new stat
-
Open the graphic settings.
-
Choose from the Stat menu.
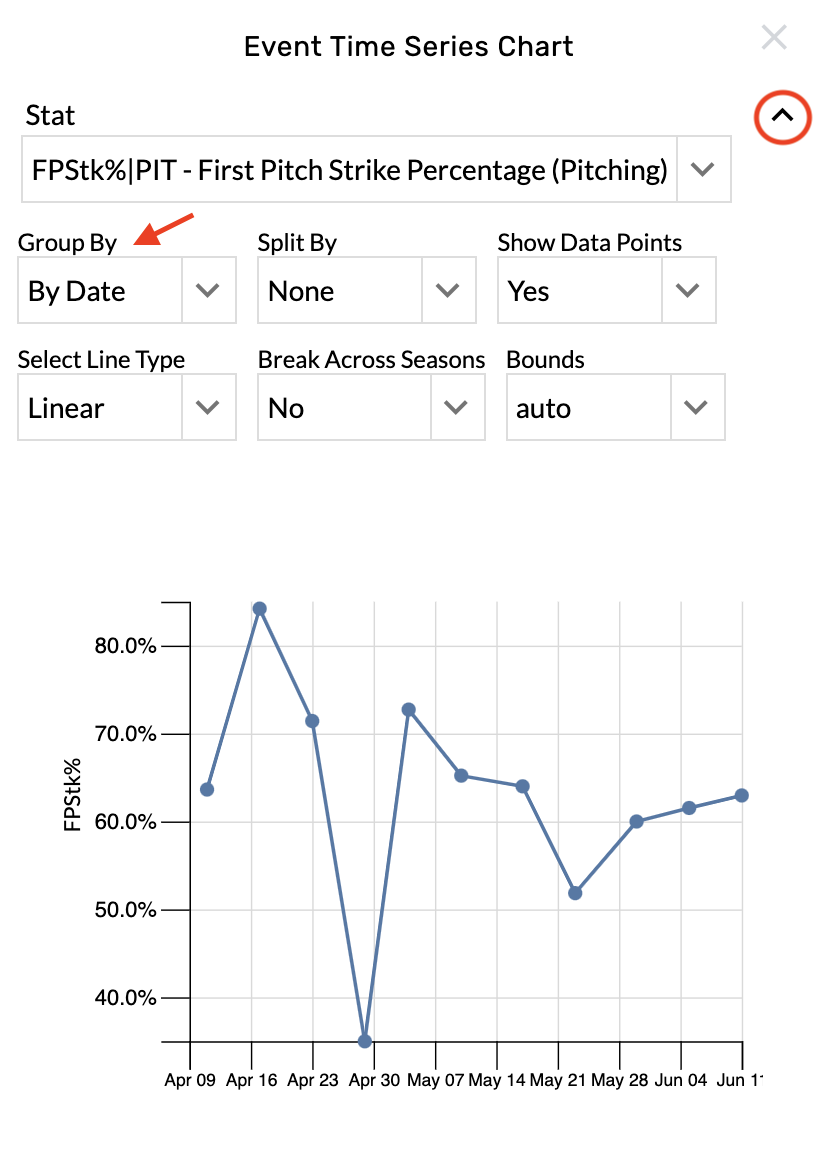
Change the time interval
-
Open the graphic settings.
-
Choose from the Group By menu.
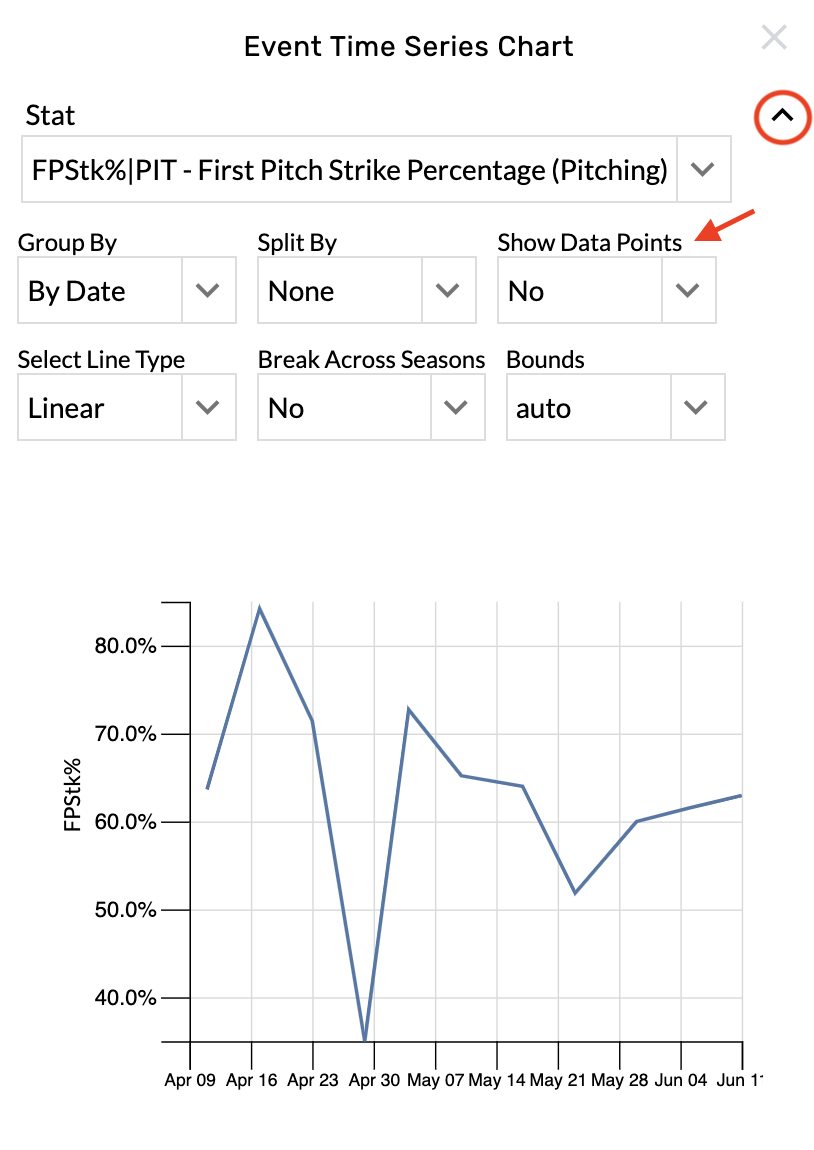
Hide the data points
-
Open the graphic settings.
-
Choose No from the Show Data Points menu.
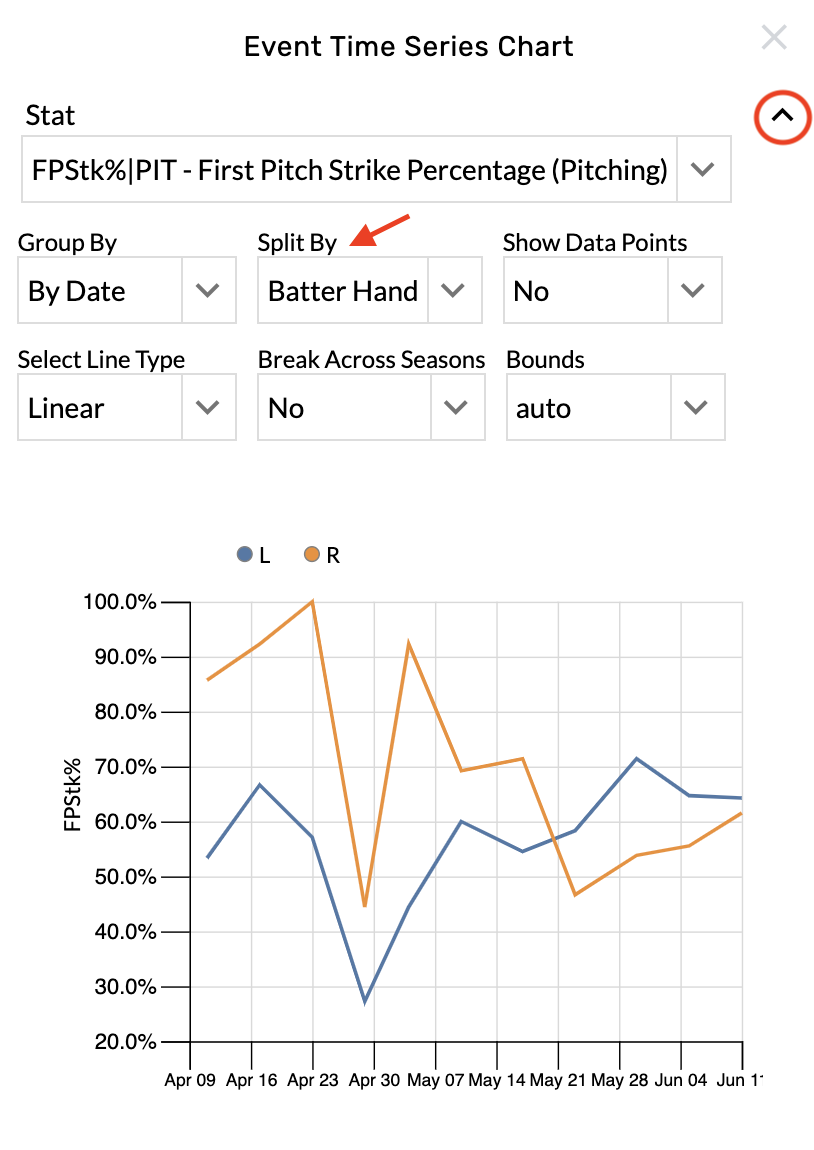
Apply splits
-
Open the graphic settings.
-
Choose from the Split By menu.
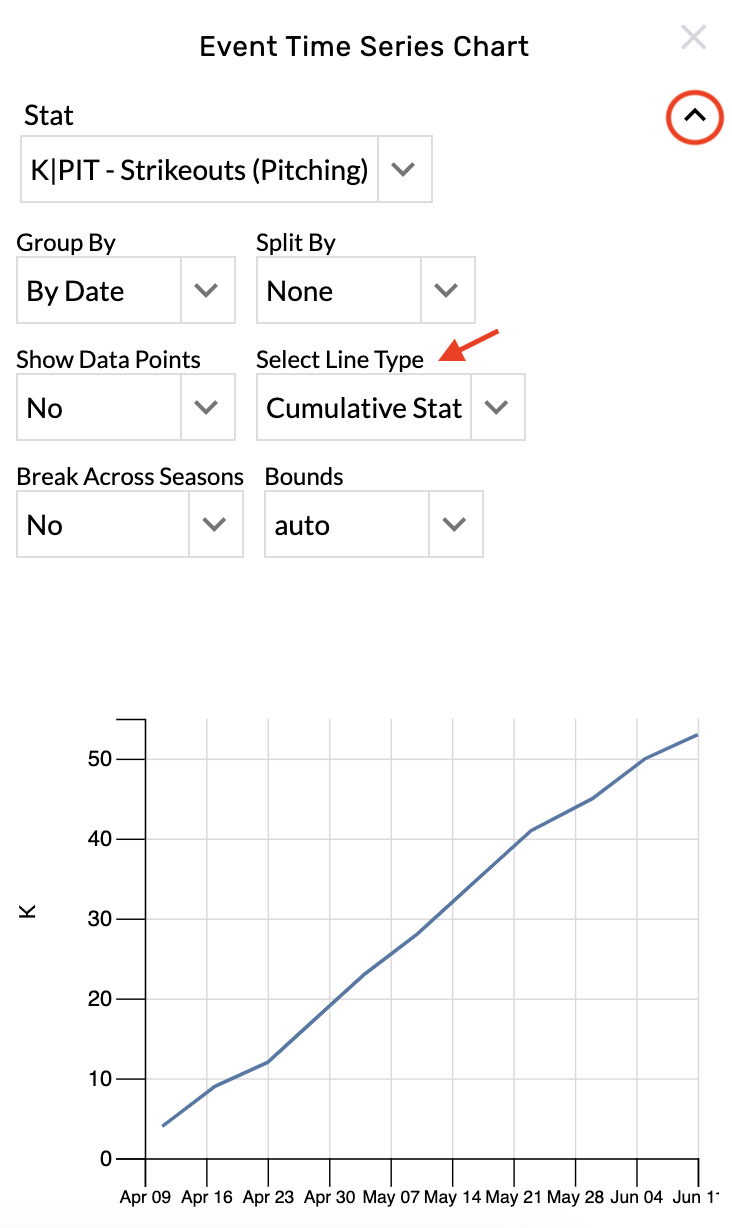
Change the line type
-
Open the graphic settings.
-
Choose from the Select Line Type menu.