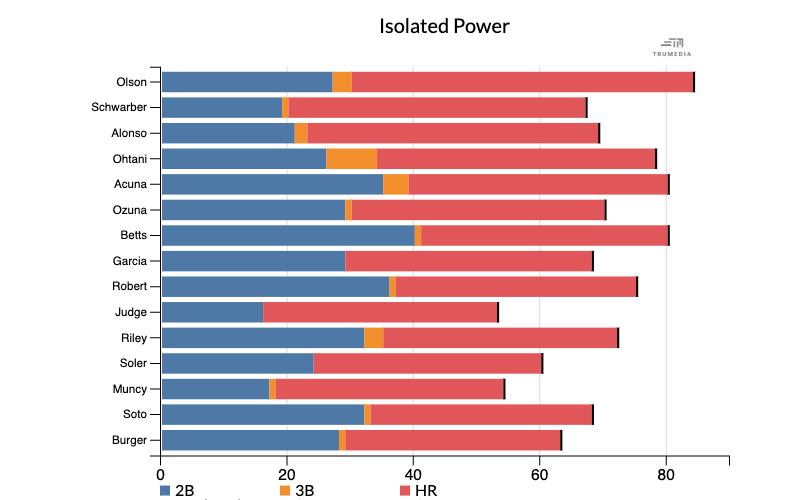
A stacked bar chart visualizes more than one stat on a single chart. This example shows the top 10 players in home runs this season, which is represent by the blue bars on the chart. Stacked on top of each blue bar is an orange one that represents triples and and red that represents doubles.
Create a Stacked Bar Chart
-
Sort the table by a stat
-
Select Stacked Bar Chart in the Graphics menu
-
Tap Plot Stat.
Add stats
-
Tap the Plot Stat on more stats.
Bar count
-
Select an option in the Bar Count menu.
Sort by a new stat
-
Sort the table below.
Show Totals Mark
-
Toggle on Show Totals Mark.
Add titles
-
Type in the text boxes.