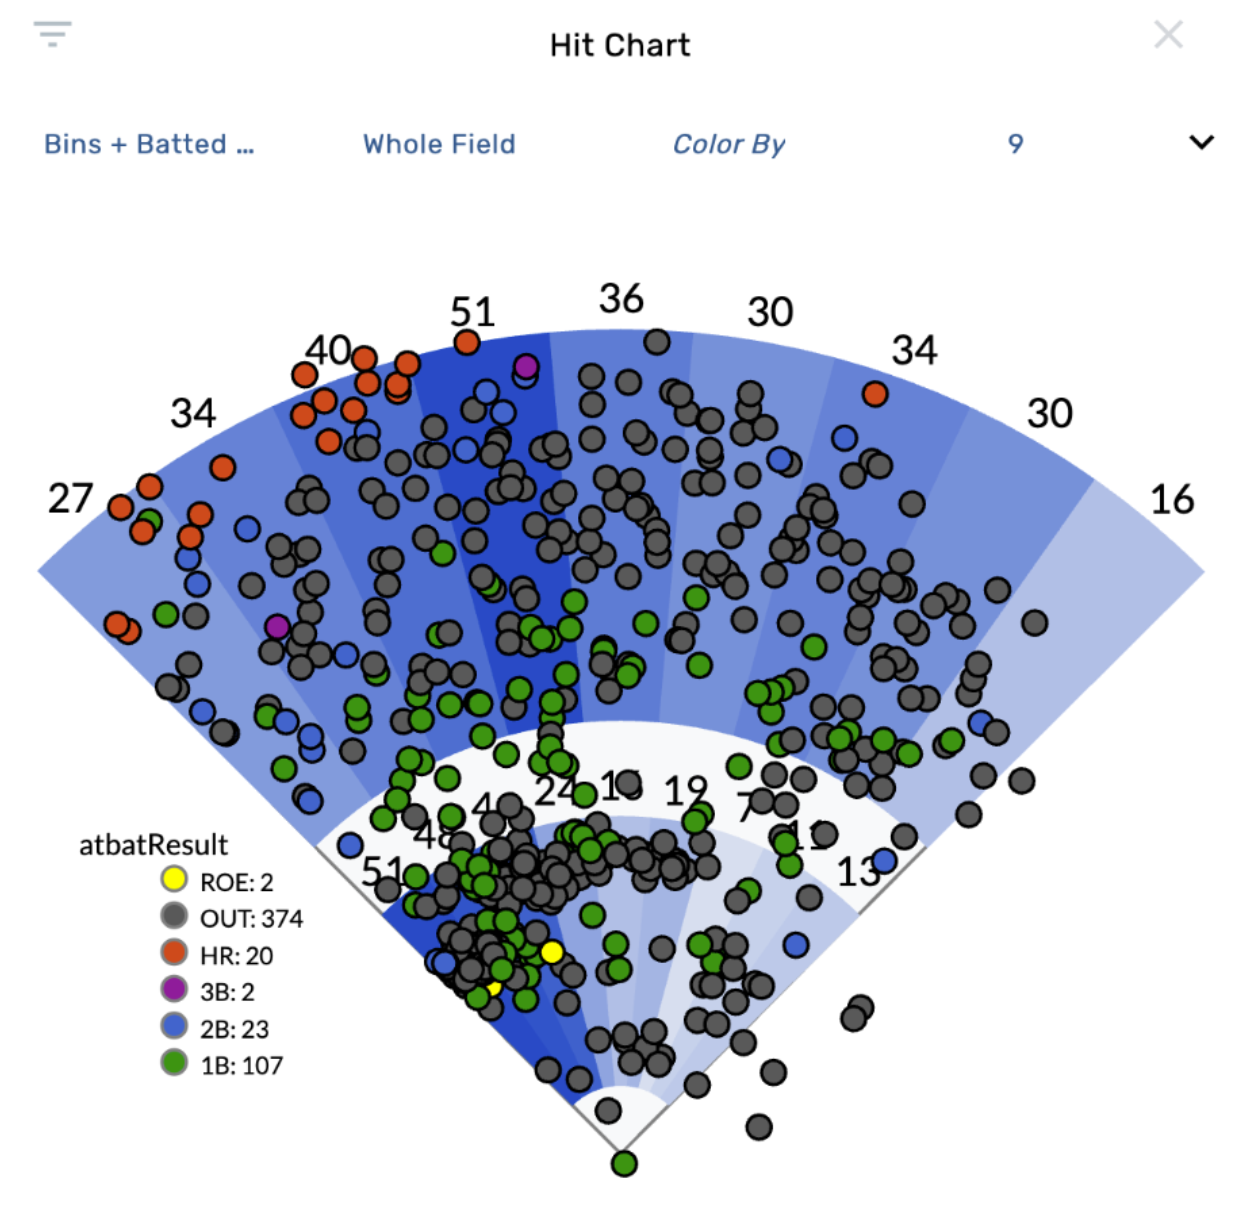
Bins + Batted Balls. Bins labeled by data count. Balls colored by at bat result.
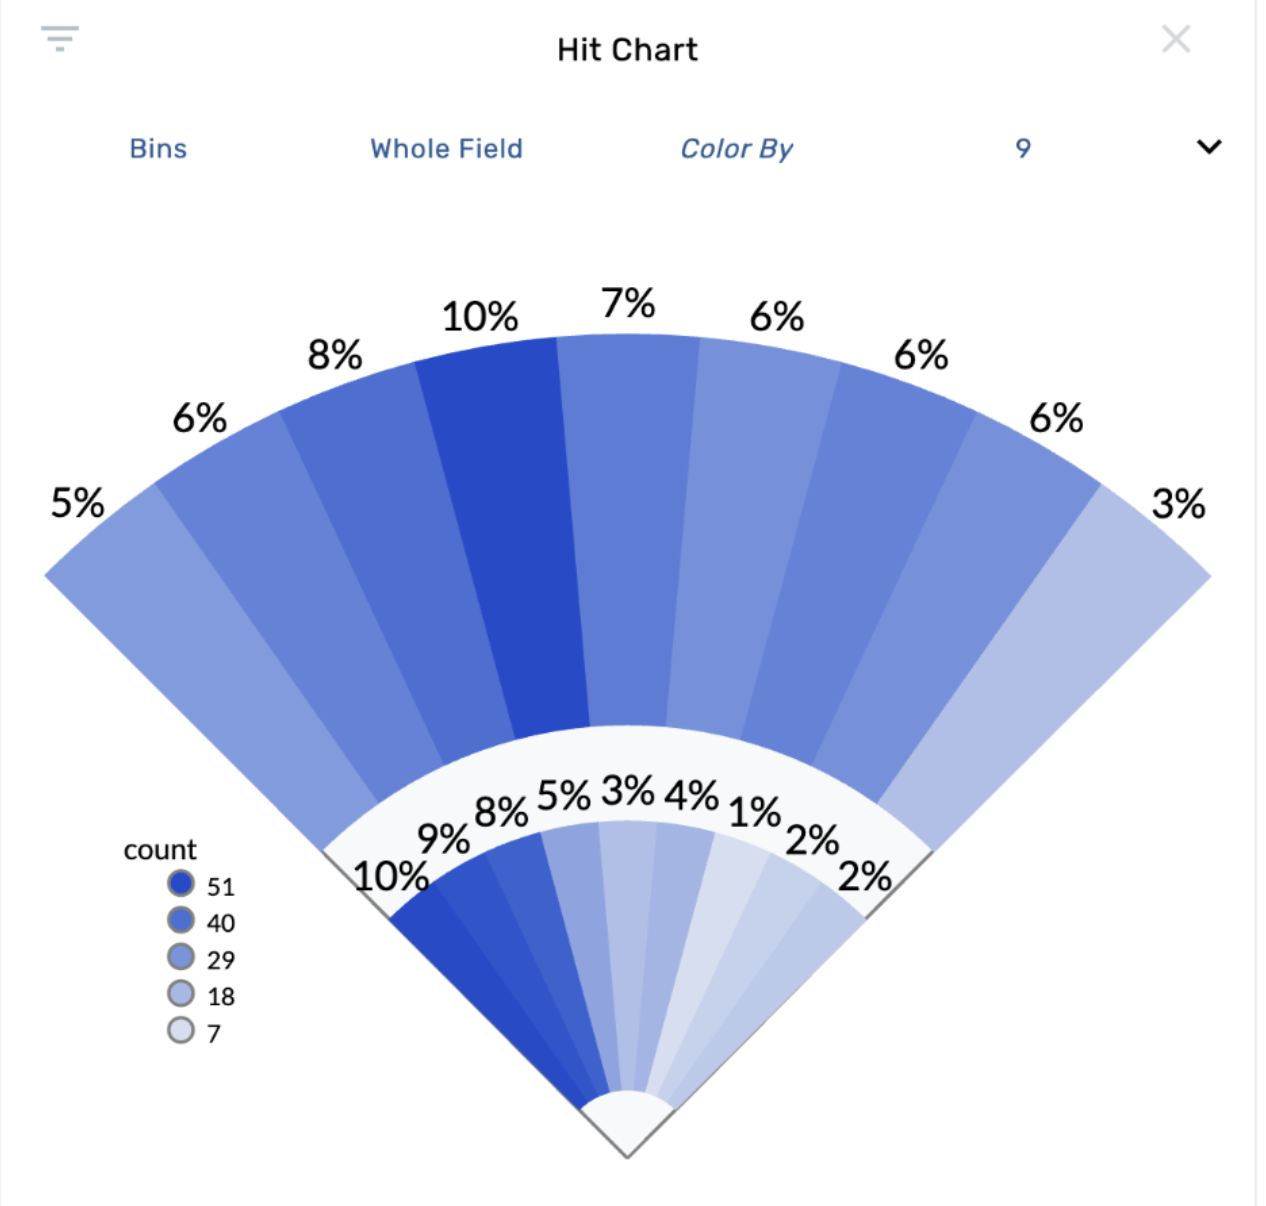
Bins Only. Bins labelled by percent. Blue color scheme.
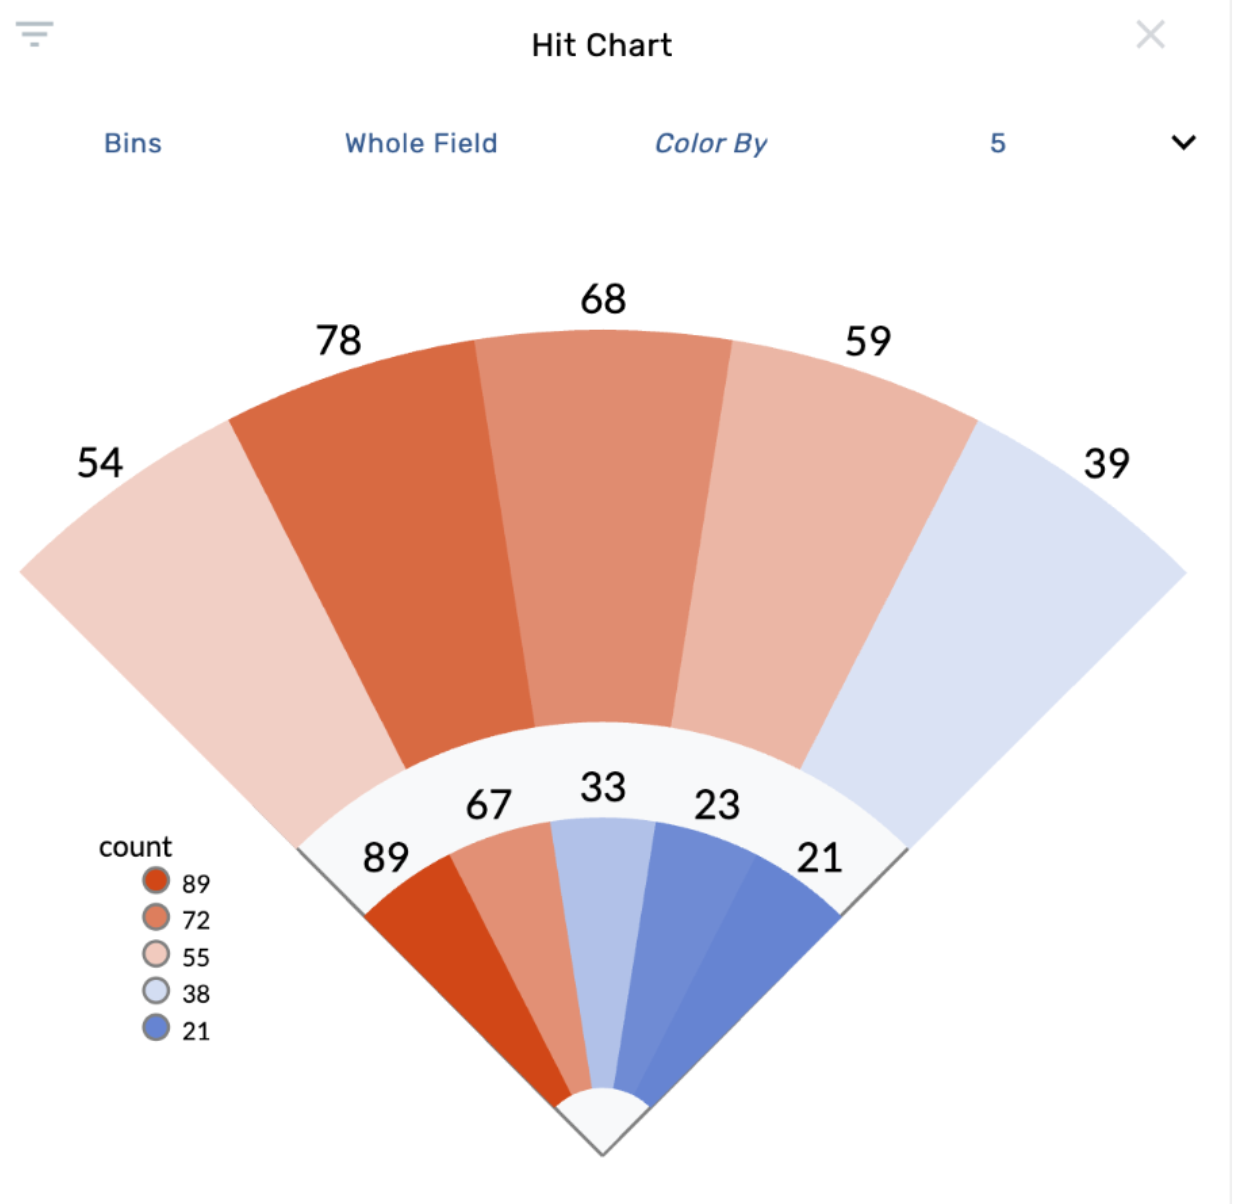
Bins Only. Bins labelled by percent. Blue->Red Color Scheme. 5 bin sectors instead of 9.
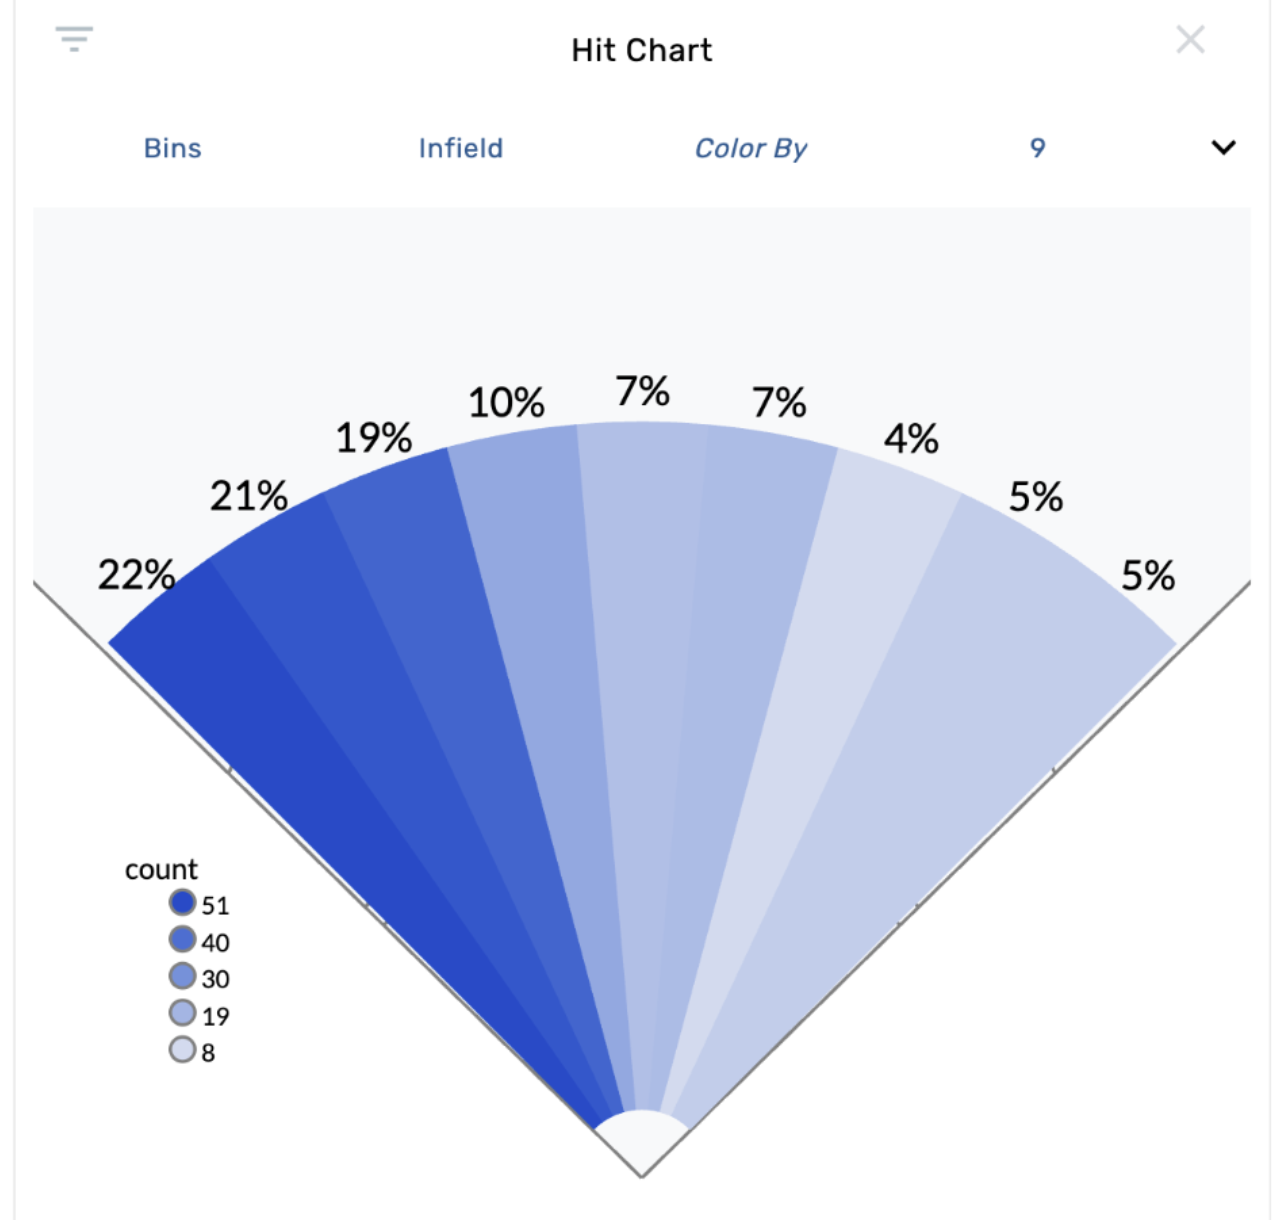
Bins Only. Data limited to infield only. 9 bins labelled by percent.
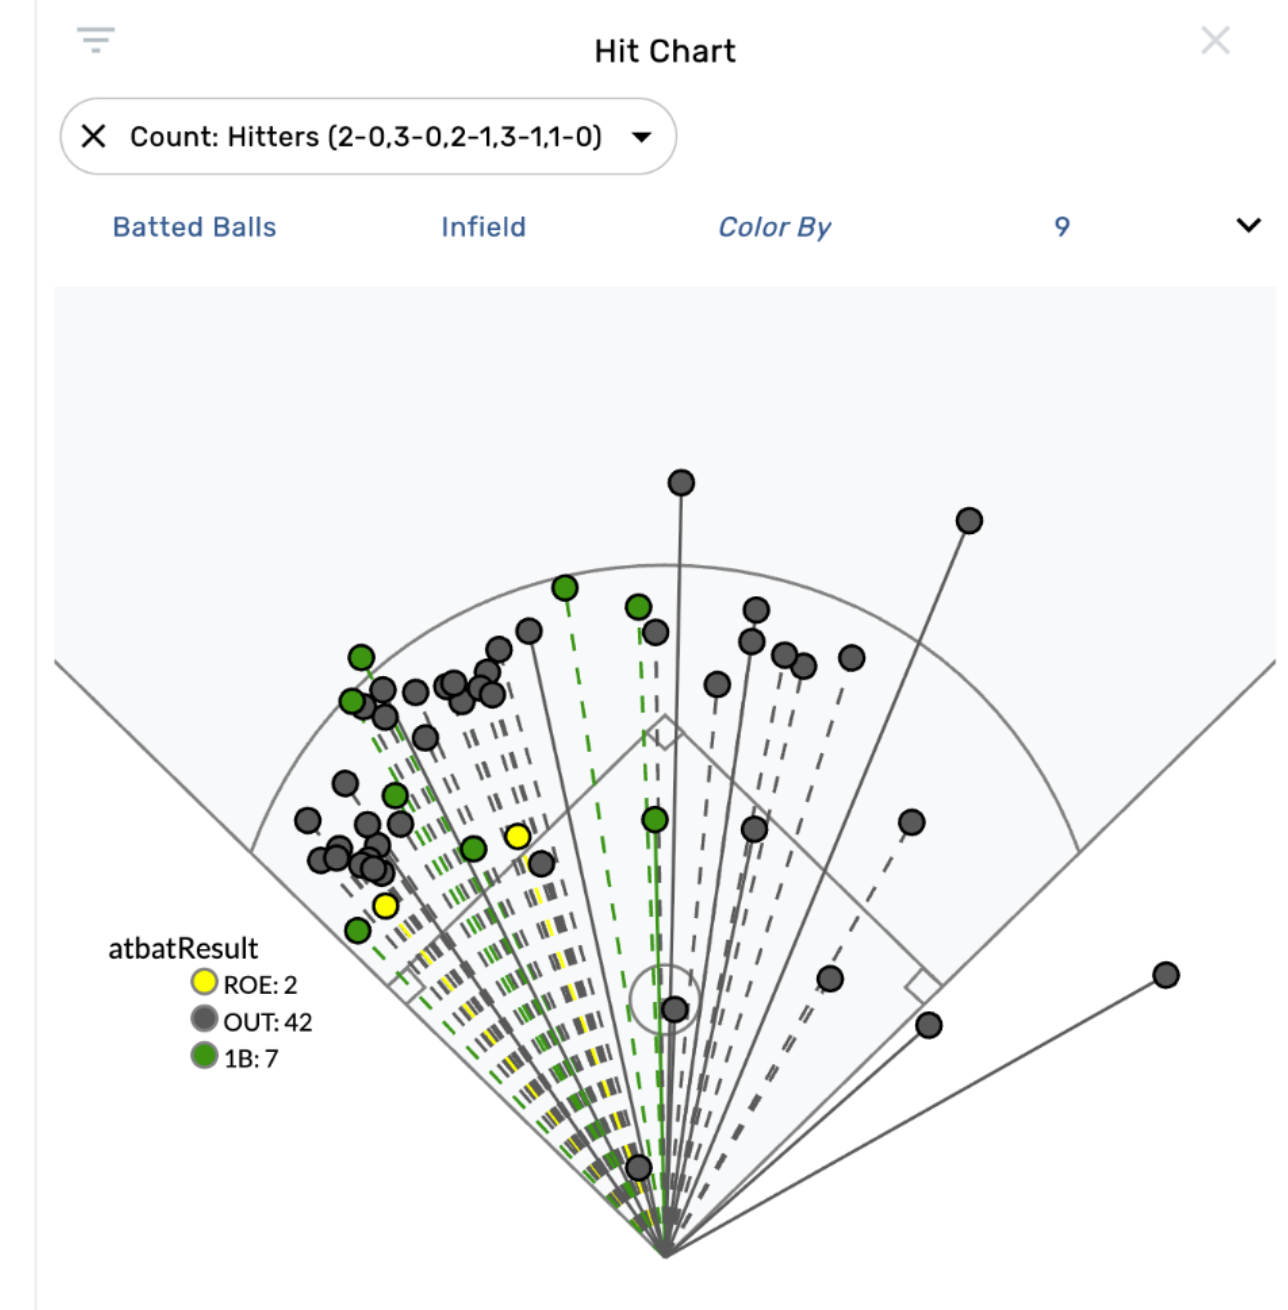
Batted Balls only. Show lines (dashed indicates grounder) Data limited to infield only. Chart filtered by hitters count.
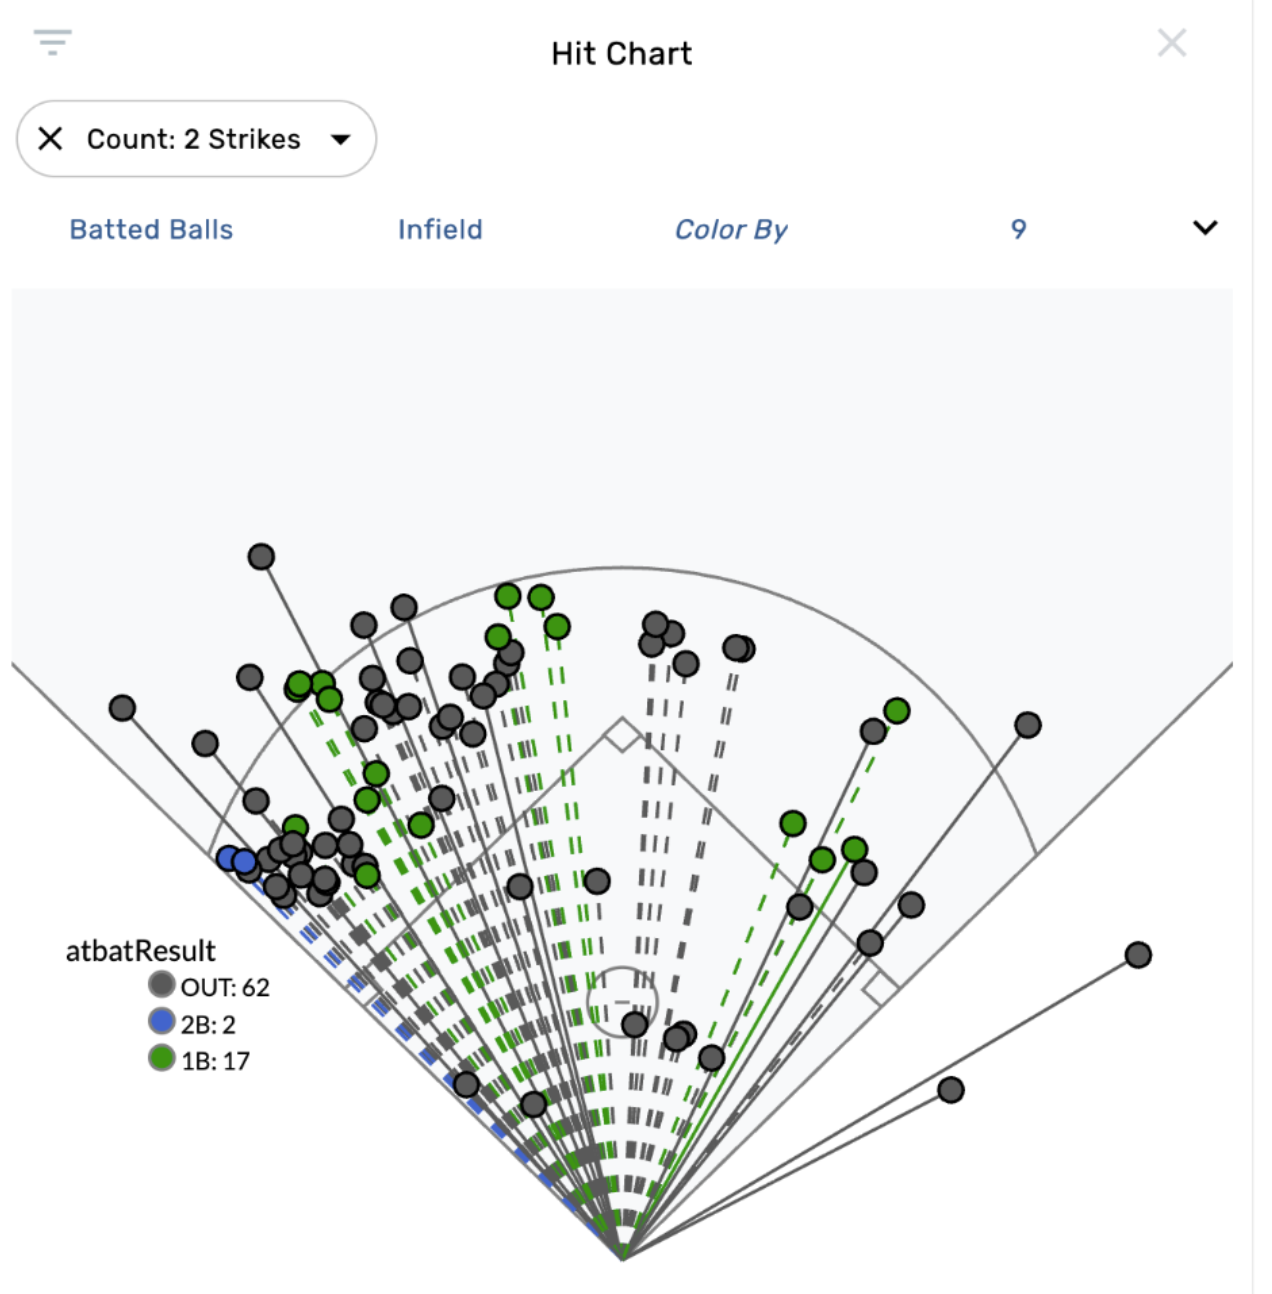
Batted Balls only. Show lines (dashed indicates grounder) Data limited to infield only. Chart filtered by 2K counts.
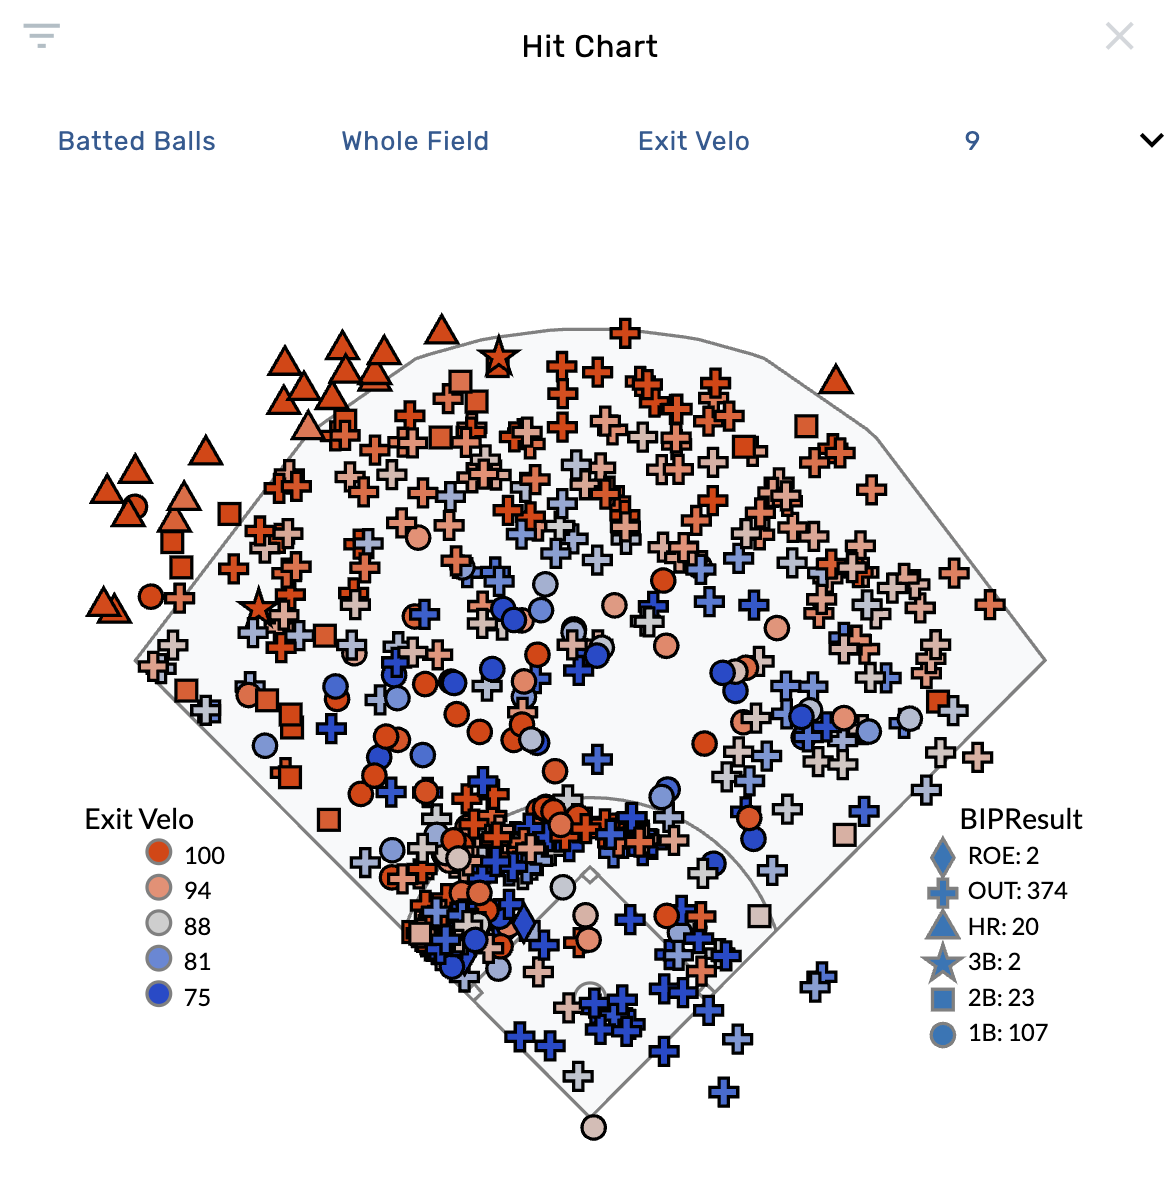
Batted Balls only. Color by Exit Velocity. Shape by Ball in play result.